Accounts of Chart
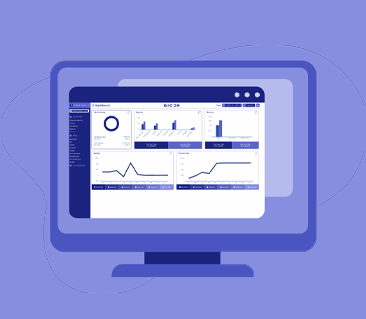
The accounting level high chart available and report in details generate, you can use software standard reports and customize report generate on request. our software cloud-based use online and offline, easy to attach with ERP and ePOS and other API available to use for integration other software
High-quality reports will include detailed accounts receivable aging reports, accounts payable aging reports, cash flow statements, balance sheets, profit and loss statements, and customizable financial reports tailored to the specific needs of the business. These reports will provide a comprehensive view of the financial health of the business and help in making informed decisions.
Cloud accounting software such as QuickBooks, Xero, or FreshBooks offer a wide range of detailed reports to help businesses manage their finances effectively. These reports can be customized and generated on demand. Here are some of the detailed reports typically available in cloud accounting systems:
Balance Sheet: This report provides a snapshot of a company’s financial position, showing its assets, liabilities, and equity at a specific point in time.
Income Statement (Profit and Loss Statement): This report shows the company’s revenues, expenses, and net income over a specific period, usually monthly, quarterly, or annually.
Cash Flow Statement: This report shows the inflow and outflow of cash and cash equivalents over a specific period. It provides insights into a company’s liquidity, solvency, and overall financial health.
Accounts Receivable Aging Report: This report categorizes outstanding customer invoices by their due dates, helping businesses track and manage their receivables effectively.
Accounts Payable Aging Report: This report categorizes outstanding vendor bills by their due dates, helping businesses track and manage their payables effectively.
General Ledger: This report provides a detailed record of all financial transactions within a specific period, showing all accounts and their transactions.
Trial Balance: This report lists all accounts and their balances to ensure that debits equal credits, serving as a preliminary step in the preparation of financial statements.
Expense Reports: These reports categorize and detail business expenses, helping businesses track spending and identify areas for cost control.
Budget vs. Actuals Report: This report compares budgeted amounts to actual performance, helping businesses assess their financial performance against the budgeted expectations.
Customizable Financial Reports: Most cloud accounting systems allow users to create tailored reports to meet specific business needs, such as departmental expenses, project profitability, or revenue by customer.
These detailed reports offer valuable insights into a company’s financial performance, enabling informed decision-making and strategic planning. They can be accessed anytime, from anywhere, and can often be shared with stakeholders such as investors, lenders, or business partners.
Chart Of Accounts
Level 1: Assets
Level 2: Current Assets
Level 3: Cash and Cash Equivalents
Level 4: Petty Cash
Level 4: Checking Account
Level 4: Savings Account
Level 3: Accounts Receivable
Level 4: Trade Receivables
Level 4: Other Receivables
Level 3: Inventory
Level 4: Raw Materials
Level 4: Work in Progress
Level 4: Finished Goods
Level 3: Prepaid Expenses
Level 4: Insurance
Level 4: Rent
Level 4: Subscriptions
Level 2: Non-current Assets
Level 3: Property, Plant, and Equipment
Level 4: Land
Level 4: Buildings
Level 4: Machinery and Equipment
Level 3: Intangible Assets
Level 4: Goodwill
Level 4: Patents
Level 4: Trademarks
Level 1: Liabilities
Level 2: Current Liabilities
Level 3: Accounts Payable
Level 4: Trade Payables
Level 4: Taxes Payable
Level 3: Accrued Expenses
Level 4: Salaries Payable
Level 4: Utilities Payable
Level 2: Non-current Liabilities
Level 3: Long-term Debt
Level 4: Bank Loans
Level 4: Bonds Payable
Level 1: Equity
Level 2: Capital
Level 3: Share Capital
Level 4: Common Stock
Level 4: Preferred Stock
Level 3: Retained Earnings
Level 1: Income
Level 2: Sales
Level 3: Product Sales
Level 3: Service Sales
Level 2: Other Income
Level 3: Interest Income
Level 3: Rental Income
Level 3: Dividend Income
Level 1: Expenses
Level 2: Cost of Goods Sold
Level 2: Operating Expenses
Level 3: Salaries and Wages
Level 3: Rent
Level 3: Utilities
Level 3: Advertising and Marketing
Level 3: Depreciation


